The SPC Connect dashboard
Product Version(s): SPC Connect 3.0
Topic last updated: January 2020
The dashboard is a customisable page that provides you, the installer, a quick overview of the status of sites that you manage. The dashboard can be configured to display summary details for your favourite sites, and summary details for recent events on the panels in your favourite sites. You can access commonly performed site management functions from the dashboard. You can configure multiple dashboards to focus on different aspects of the sites you manage. Dashboards can be private or shared.
About dashboard widgets
-
Audit Trail
Displays a list of audit events for your company SPC Connect account in reverse-chronological order.
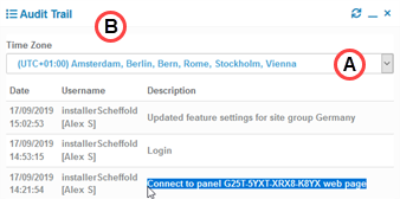
A: Click to change the time zone used to display the event date and times.
B: Click to open the Audit Trail page with full audit details.
For more information on the audit trail, see Audit trail.
-
Favourite Site Events
Displays summary details for recent events on the panels in sites you have marked as favourites.
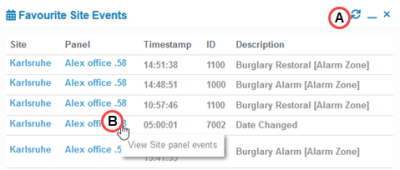
A : Click Refresh
 to update the list of events.
 B: Click a panel name to view the Events page for that panel.
For more information on panel events, see Events.
-
Favourite Sites
Displays summary information for sites you have marked as favourites. For information on marking sites as favourites, see How do I mark a site as a favourite?.
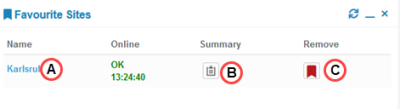
A: Click a site name to view the Site Settings page for that site.
B: Click Summary
 to view information about this site on the System Summary page.
 C: Click Remove
 to remove this site from your favourites.
 -
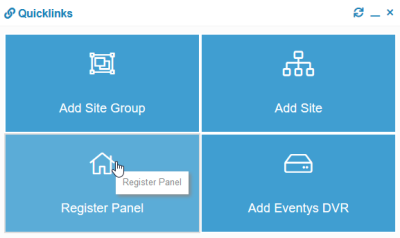
Quicklinks
Displays quick links to the following common site administration functions: Add Site Group, Add Site, Register Panel, Add Eventys DVR.
-
Sites and Users
Displays the number of system users, sites and installers that you can manage through this company.
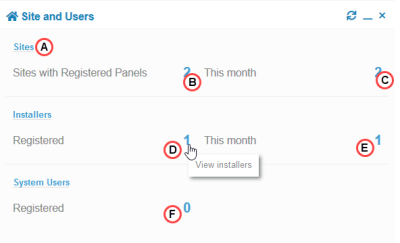
A: Click to see all sites to which you have access on the Sites page.
B: Click this number to see the Sites page filtered to show sites with registered panels only.
C: Click this number to see the Sites page filtered to show sites registered this month only.
D: Click to see all installers to which you have access on the Installers page.
E: Click to see the Installers page filtered to show installers registered this month only.
F: Click to see all system users to which you have access on the System Users Company Panels page.
-
Site Config Status
Displays status information for sites with configuration manager backups and remote maintenance reports enabled.
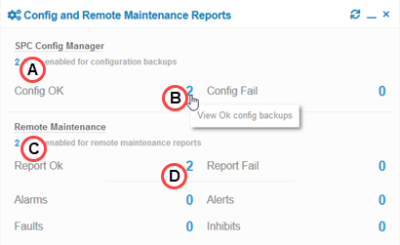
A:Click this number to see a list of configuration backups for every site/panel on the SPC Configuration Manager page.
B: Click the number beside a particular backup status to see the SPC Configuration Manager page filtered to show backups with that status.
C: Click this number to see a list of remote maintenance reports for every site/panel on the Remote Maintenance page.
D: Click the number beside a particular report status to see the page filtered to show reports with that status.
For more information on configuration manager, see Configuration manager.
For more information on remote maintenance reports, see Remote maintenance.
-
Panel Firmware
Displays information on how many panels registered to the company are running different panel firmware versions. Newer browsers display the data in a pie chart; older browsers may show a table of data instead.
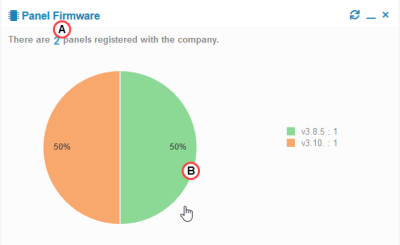
A: Click the number of sites to see the Sites page listing all of the sites.
B: Click a chart segment, or the corresponding element in the chart legend, to see the Sites page filtered to show the sites with panels running that firmware version.
For information on how to perform a firmware upgrade on panels from SPC Connect, see Firmware upgrade.
-
Site Groups
Displays summary details for site groups registered in your company, including the numbers of sites, panels and installers in the site group.
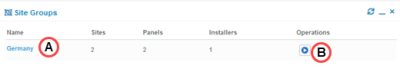
A: Click the name of a site group to view information about that site group on the Site Group Settings page.
B: Click Operations
 for a site group to open the Multisite Operations page for the site group.
For more information on sites and site groups, see Sites and site groups.
-
Site Status
Displays status information for sites to which you have access in SPC Connect.
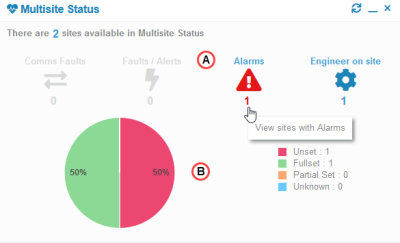
A: Icons indicate the number of sites with faults, alerts, alarms, or an engineer on site. Click the number below a status to see Site Status page filtered to show sites containing panels with that status.
B: A pie chart and legend shows the number of panels in each of the following states: unset, fullset, partial set, unknown. Click a chart segment, or the corresponding element in the chart legend, to see the Site Status page filtered to show sites containing panels in that state.
For more information on multisite status, see Multisite status.
-
Sites Map
Displays an interactive map with markers for the company location and the locations of each site you can manage.
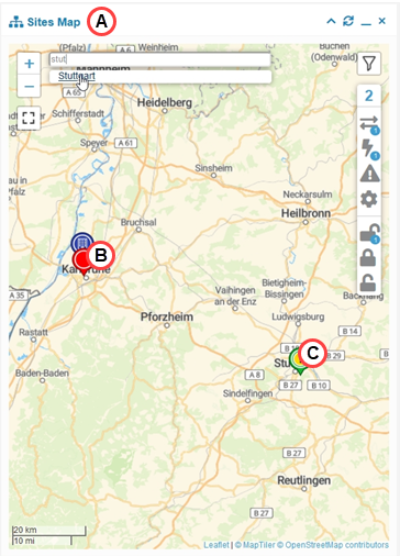
A: Click Sites Map to see all sites to which you have access on the Sites page.
B: Click the marker for the company to view summary information about the location in a popup. In the popup you can:
-
Click View company settings to open the Company Settings page.
-
Click View company location settings to open the Company location settings page where you can view and edit the company location on an interactive map.
C: Click the marker for a site to view summary information about the site in a popup. In the popup you can:
-
Click View site settings to open the Site Settings page.
-
Click View summary for panel for any panel to open the System Summary page, focused on details for that panel.
-
Click View site location settings to open the Site location settings page. This page enables you to view and edit the site location on an interactive map.
-
The following widgets auto-refresh periodically:
-
Multisite Status
-
Sites Map
The data displayed by other widgets should be manually refreshed by clicking the Refresh ![]() icon on the widget title bar.
icon on the widget title bar.
To see data in dashboard widgets, you must be assigned an installer profile with rights to view that type of data, and you must have access to site groups and sites for which data are available.
Creating, designing and managing dashboards
Click Dashboard Options > ![]() New, enter a dashboard Name, select basic dashboard settings, then click Save.
New, enter a dashboard Name, select basic dashboard settings, then click Save.
Note: Give careful consideration to your choice of layout – this cannot be changed after the dashboard is created.
Click Dashboard Options > ![]() Edit, enter a Name, and click Save.
Edit, enter a Name, and click Save.
Note: Bear in mind that if you rename a shared dashboard, the new name appears for every installer with access to that dashboard.
Click Dashboard Settings, select the check box for each widget you want on the current dashboard, then click Save.
Click the x icon in the top-right corner of that widget.
Hover your mouse over the title bar of any widget until it turns into a crosshairs ![]() , then hold down your left mouse button and drag the widget to a new position. Once a dashed rectangle outline appears behind the widget, indicating its new position, release your mouse button to drop the widget.
, then hold down your left mouse button and drag the widget to a new position. Once a dashed rectangle outline appears behind the widget, indicating its new position, release your mouse button to drop the widget.
The dashboard layout cannot be changed after the dashboard is created. You should create a new dashboard with the required layout and add widgets if you want a different layout.
Yes! To minimize a widget, click the Minimize ![]() icon in the widget title bar. To reopen a minimized widget, click the Maximize
icon in the widget title bar. To reopen a minimized widget, click the Maximize ![]() icon on the widget title bar.
icon on the widget title bar.
If you have multiple dashboards, use the Dashboard drop-down to switch between dashboards. Dashboards that have been shared with you by another installer are listed in a Shared Dashboards area on the Dashboard menu.
Your default dashboard is identified by the following icon: ![]() . Note that you can only make a dashboard you created your favourite; you cannot favourite a dashboard that has been shared by another installer.
. Note that you can only make a dashboard you created your favourite; you cannot favourite a dashboard that has been shared by another installer.
If you have read only access to a shared dashboard, that dashboard is identified by the following icon: ![]() .
.
If you have write access to a shared dashboard, that dashboard is identified by the following icon: ![]() .
.
Use the Dashboard drop-down to switch to the dashboard you want to share. Click Dashboard Options > ![]() Edit, select whether to share the dashboard as Read Only or with Write Access, then click Save. Once you have shared a dashboard, the dashboard configuration (layout and widget selection) is available to all installers in your company, but each installer will only see the data to which they have access. For example, if you use the Favourite Sites widget, you will see your favourites on a shared dashboard, but other installers will see their favourites instead.
Edit, select whether to share the dashboard as Read Only or with Write Access, then click Save. Once you have shared a dashboard, the dashboard configuration (layout and widget selection) is available to all installers in your company, but each installer will only see the data to which they have access. For example, if you use the Favourite Sites widget, you will see your favourites on a shared dashboard, but other installers will see their favourites instead.
Using the map
If the GPS coordinates of a site are recorded in SPC Connect, it automatically appears on the map. To configure the GPS coordinates for a site:
-
Click
 Configuration >
  Sites, then click the site name on the Sites page.
 -
Click Edit
 beside the GPS Coordinates field on the Site Settings page.
 -
Enter all or part of the address in the Search address field to quickly find the right area of the map. Alternatively, drag the map and use the zoom in/out tools to find the location.
-
Right-click the point on the map where the site is located and select Move site marker here.
-
Click Save
 .
.